Introduction
- Clinical laboratories help doctors diagnose and monitor diseases through laboratory tests.
- Accurate laboratory results are essential for proper patient care and treatment.
- Quality Control (QC) ensures that laboratory test results are accurate and reliable.
- QC helps detect errors in instruments, reagents, and testing procedures.
- It improves the accuracy and consistency of laboratory results.
- Laboratories perform Quality Control before reporting patient test results.
- A good QC system improves patient safety and maintains high laboratory standards.
What is Quality Control?
Quality Control (QC) is the process of checking laboratory tests using control samples to ensure that instruments, reagents, and testing methods are working correctly.
Definition
Quality Control is a system of procedures used to monitor the accuracy and precision of laboratory testing by analyzing control materials before patient samples.
Why is Quality Control Important?
Quality control helps laboratories:
- Ensure accurate patient results
- Detect laboratory errors early
- Improve precision
- Monitor instrument performance
- Check reagent quality
- Reduce repeat testing
- Increase clinician confidence
- Meet accreditation standards (NABL, ISO 15189, CAP)
Types of Quality Control
There are two major types:
| Type | Purpose |
|---|---|
| Internal Quality Control (IQC) | Daily monitoring within the laboratory |
| External Quality Assessment (EQA/PT) | Comparison with other laboratories |
Materials Used in Quality Control
Types of Quality Control Materials
1. Normal Control
- Contains analyte levels within the normal reference range.
- Used to monitor routine laboratory performance.
- Ensures accurate results for normal patient samples.
2. Abnormal (Pathological) Control
- Contains analyte levels above or below the normal range.
- Used to evaluate the performance of tests in abnormal or disease conditions.
- Helps verify the accuracy of clinically significant results.
3. Lyophilized (Freeze-Dried) Control
- Available in a dry powder form.
- Requires reconstitution with distilled water before use.
- Has a longer shelf life and is easy to store.
4. Liquid Control
- Ready-to-use control material.
- Does not require reconstitution.
- Convenient for routine daily quality control but has a shorter shelf life after opening.
5. Commercial Control Serum
- Prepared by certified manufacturers.
- Contains assigned target values for multiple biochemical analytes.
- Commonly used in clinical chemistry laboratories for routine Internal Quality Control (IQC).
Characteristics of an Ideal Quality Control Material
An ideal quality control material should:
- Have stable and well-defined target values.
- Be similar to human patient samples (matrix-matched).
- Cover both normal and abnormal concentration levels.
- Be stable during storage and transportation.
- Produce consistent and reproducible results.
- Be easy to prepare and use.
- Have a long shelf life.
Steps of Quality Control
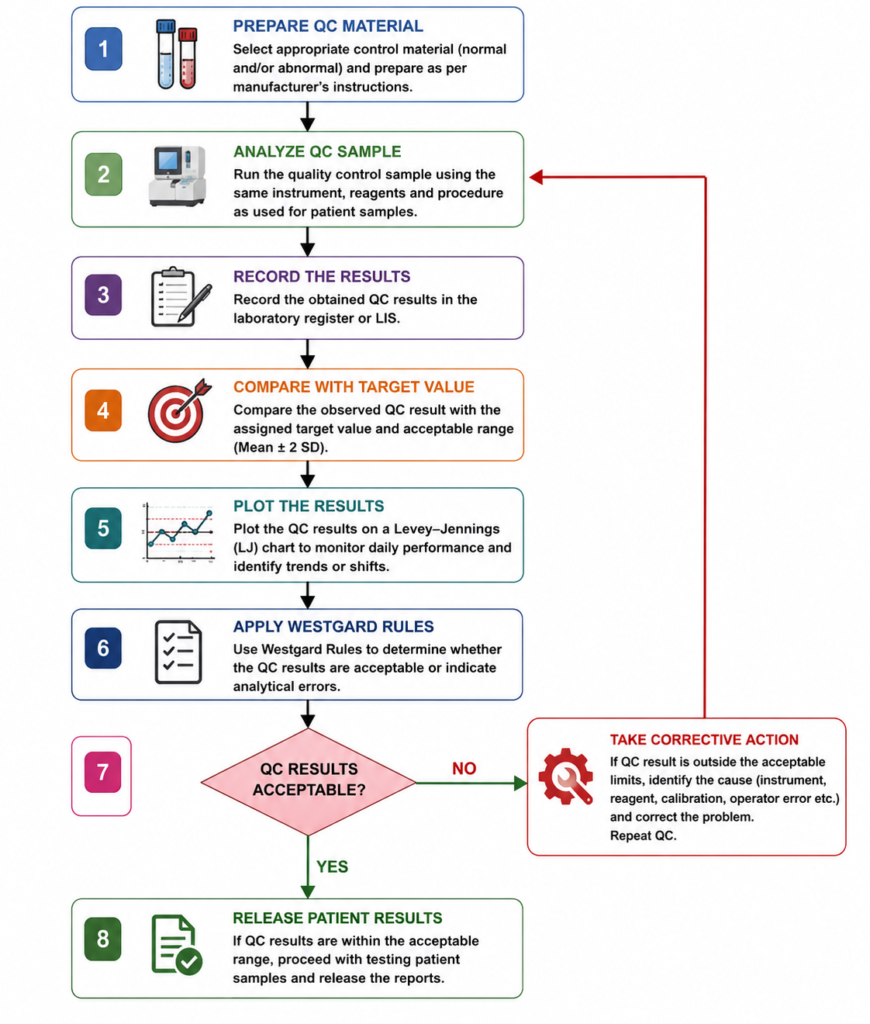
Mean and Standard Deviation
- Mean and Standard Deviation (SD) are important statistical measures used in clinical laboratory quality control.
- They help evaluate the accuracy and precision of laboratory test results.
1. Mean (Average)
- The mean is the average value obtained by analyzing the same quality control (QC) sample multiple times.
- It represents the expected or target value around which QC results should fall.
Formula:
Mean = ΣX / n
Where:
- ΣX = Sum of all observations
- n = Number of observations
Example:
Mean = (98 + 100 + 101 + 99 + 102) / 5
Mean = 500 / 5 = 100 mg/dL
Interpretation:
- The mean value is 100 mg/dL.
- This becomes the target value for monitoring future QC results.
2. Standard Deviation (SD)
Standard Deviation (SD) measures how much the QC results vary or spread around the mean. It indicates the precision of the laboratory test.
- Low SD = Results are close to the mean (high precision).
- High SD = Results are widely scattered (low precision).
Formula:
Where:
- X = Individual observation
- X̄ = Mean
- n = Number of observations
Interpretation:
- Small SD: Better precision and more consistent results.
- Large SD: Poor precision and greater variation in results.
Importance of Mean and SD in Quality Control
- Establish the acceptable range for QC results.
- Monitor the accuracy and precision of laboratory tests.
- Form the basis of the Levey–Jennings chart.
- Help apply Westgard Rules to detect analytical errors.
- Ensure reliable and consistent patient test results.
Coefficient of Variation (CV%)
- The Coefficient of Variation (CV%) is a statistical measure used in clinical laboratory quality control to assess the precision of a laboratory test.
- It expresses the standard deviation as a percentage of the mean, making it easier to compare the precision of different tests.
Formula
CV (%) = (Standard Deviation ÷ Mean) × 100
or
CV (%) = (SD / Mean) × 100
Example
Suppose:
- Mean = 100 mg/dL
- Standard Deviation (SD) = 2 mg/dL
CV (%) = (2 ÷ 100) × 100 = 2%
Interpretation
- Low CV% indicates high precision and consistent test results.
- High CV% indicates low precision and greater variation in results.
Importance of CV%
- Measures the precision of laboratory tests.
- Compares the performance of different laboratory methods or instruments.
- Helps monitor the consistency of Quality Control (QC) results.
- Detects variations in analytical performance over time.
- Assists in maintaining reliable and accurate patient test results.
General Interpretation of CV%
| CV (%) | Interpretation |
|---|---|
| < 5% | Excellent precision |
| 5–10% | Good precision |
| 10–20% | Acceptable precision (depends on the test) |
| > 20% | Poor precision; investigation required |
Levey–Jennings Chart
- The Levey–Jennings (LJ) Chart is a graphical quality control tool used in clinical laboratories to monitor the performance of laboratory tests over time.
- It helps determine whether the analytical process is accurate, precise, and under statistical control.
- The chart was introduced by Stanley Levey and E.R. Jennings in 1950 and is widely used in Internal Quality Control (IQC).
Components of a Levey–Jennings Chart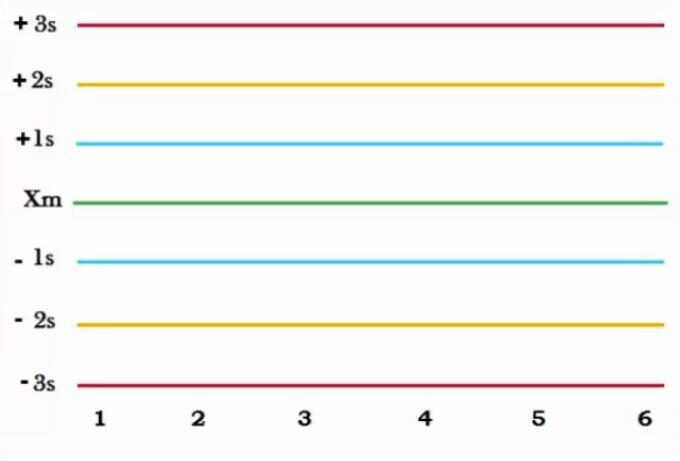
A Levey–Jennings chart consists of:
- X-axis: Days, runs, or dates of quality control testing.
- Y-axis: Measured values of the quality control sample.
- Mean (X̄): The average value of the QC results.
- ±1 SD: First standard deviation limits.
- ±2 SD: Warning limits.
- ±3 SD: Rejection limits.
Each quality control result is plotted on the chart and connected with a line to observe changes over time.
How to Use a Levey–Jennings Chart
- Analyze the quality control sample daily.
- Calculate the Mean and Standard Deviation (SD).
- Draw the mean and SD lines (±1 SD, ±2 SD, and ±3 SD).
- Plot each QC result on the chart.
- Observe the pattern of results.
- Apply Westgard Rules to determine whether the run is acceptable or should be rejected.
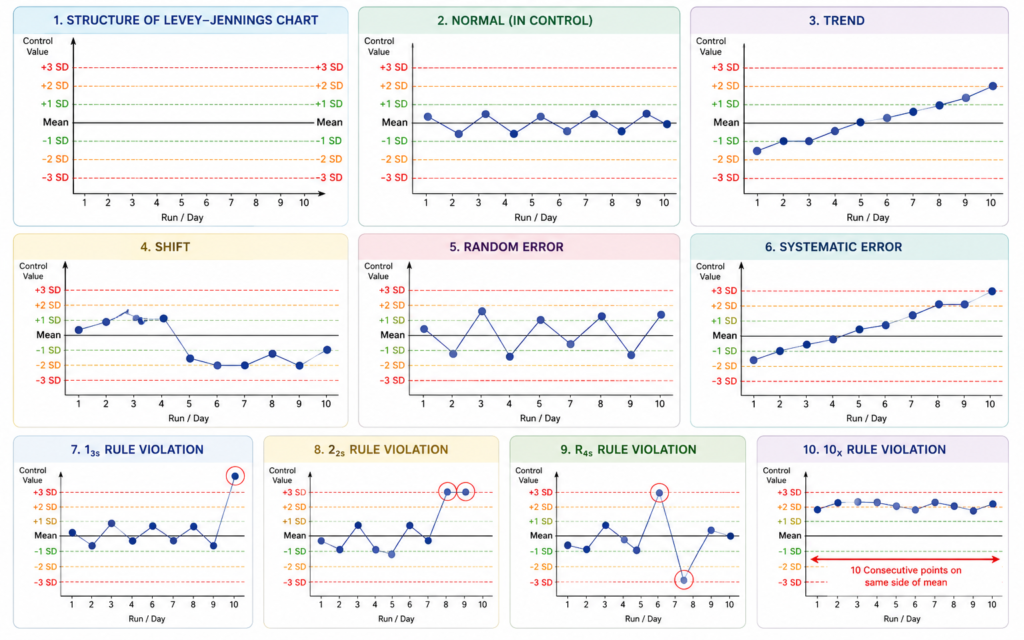
Interpretation of the Levey–Jennings Chart
- Results close to the mean: Good accuracy and precision.
- Results within ±2 SD: Generally acceptable.
- Results beyond ±3 SD: Indicate significant analytical error; the run should be rejected.
- Trend: Consecutive results gradually move upward or downward, suggesting instrument drift or reagent deterioration.
- Shift: Several consecutive results fall on one side of the mean, indicating a systematic error.
Advantages of the Levey–Jennings Chart
- Easy to prepare and interpret.
- Monitors daily laboratory performance.
- Detects random and systematic errors.
- Helps identify trends and shifts in test results.
- Supports the application of Westgard Rules.
- Improves the accuracy and reliability of patient test results.
Limitations
- Cannot identify the exact cause of an error.
- Requires regular plotting and interpretation.
- Should be used together with Westgard Rules for effective quality control.
Westgard Rules
1. 1₂s Rule (Warning Rule)
- One QC result exceeds ±2 SD from the mean.
- This is a warning rule only.
- Do not reject the run immediately.
- Carefully observe the next QC results.
Interpretation: Indicates a possible analytical error but does not necessarily require rejection.
2. 1₃s Rule (Rejection Rule)
- One QC result exceeds ±3 SD from the mean.
- Indicates a significant analytical error.
- The QC run should be rejected.
Interpretation: May indicate either a random error or a systematic error.
3. 2₂s Rule (Rejection Rule)
- Two consecutive QC results exceed ±2 SD on the same side of the mean.
- Indicates a systematic error.
- Reject the analytical run.
Interpretation: Suggests a persistent problem such as calibration error or reagent deterioration.
4. R₄s Rule (Rejection Rule)
- The difference between two QC results within the same run exceeds 4 SD.
- One control is above +2 SD, while another is below −2 SD.
- Reject the run.
Interpretation: Indicates a random error, often caused by pipetting errors or instrument instability.
5. 4₁s Rule (Rejection Rule)
- Four consecutive QC results exceed ±1 SD on the same side of the mean.
- Indicates a systematic error.
- Reject the run.
Interpretation: Suggests a consistent shift in analytical performance.
6. 10x Rule (Rejection Rule)
- Ten consecutive QC results fall on the same side of the mean, even if they are within ±1 SD.
- Indicates a systematic shift.
- Reject the run.
Interpretation: Often caused by calibration changes, reagent problems, or instrument drift.
Summary Table of Westgard Rules
| Rule | Criteria | Error Detected | Action |
|---|---|---|---|
| 1₂s | One result outside ±2 SD | Warning | Accept with caution |
| 1₃s | One result outside ±3 SD | Random/Systematic | Reject run |
| 2₂s | Two consecutive results outside ±2 SD on the same side | Systematic | Reject run |
| R₄s | Difference between two controls > 4 SD | Random | Reject run |
| 4₁s | Four consecutive results outside ±1 SD on the same side | Systematic | Reject run |
| 10x | Ten consecutive results on the same side of the mean | Systematic | Reject run |
Advantages of Westgard Rules
- Detect analytical errors at an early stage.
- Improve the accuracy and reliability of laboratory results.
- Reduce the risk of reporting incorrect patient results.
- Monitor instrument and reagent performance.
- Support laboratory accreditation and quality assurance programs.
Limitations
- Require regular QC monitoring and proper interpretation.
- Incorrect application may lead to unnecessary rejection of acceptable runs.
- Should always be used together with the Levey–Jennings chart for effective quality control.
Types of Laboratory Errors
1. Random Errors
- Random errors occur unpredictably and affect the precision of laboratory test results.
- They cause results to vary in different directions and are difficult to reproduce.
Causes
- Pipetting errors
- Air bubbles in samples or reagents
- Electrical fluctuations
- Instrument instability
- Temperature variations
- Operator mistakes
Characteristics
- Occur by chance.
- Results are scattered around the mean.
- Affect precision, not accuracy.
- Usually detected by the R₄s or 1₃s Westgard rules.
Example
A glucose control sample gives the following results:
98, 101, 97, 103, 99 mg/dL
These values vary randomly around the mean, indicating a random error.
2. Systematic Errors
- Systematic errors occur consistently in the same direction and affect the accuracy of laboratory test results.
- They produce results that are either consistently higher or consistently lower than the true value.
Causes
- Incorrect calibration
- Expired or deteriorated reagents
- Instrument malfunction
- Improper preparation of standards
- Incorrect reagent storage
- Poor maintenance of equipment
Characteristics
- Occur repeatedly in the same direction.
- Results show a shift or trend on the Levey–Jennings chart.
- Affect accuracy.
- Commonly detected by the 2₂s, 4₁s, and 10x Westgard rules.
Example
If the actual glucose control value is 100 mg/dL, but the analyzer repeatedly reports 106, 107, 108, 106, and 107 mg/dL, the results indicate a systematic error.
Difference Between Random and Systematic Errors
| Feature | Random Error | Systematic Error |
|---|---|---|
| Definition | Unpredictable variation in results | Consistent deviation in one direction |
| Affects | Precision | Accuracy |
| Pattern | Scattered around the mean | Shift or trend from the mean |
| Common Causes | Pipetting mistakes, air bubbles, electrical fluctuations | Calibration errors, expired reagents, instrument malfunction |
| Detection | R₄s, 1₃s rules | 2₂s, 4₁s, 10x rules |
| Corrective Action | Repeat the test, check pipetting and instrument | Recalibrate the instrument, replace reagents, perform maintenance |
Common Causes of QC Failure
1. Instrument Problems
- Instrument malfunction
- Poor maintenance
- Dirty probes or cuvettes
- Incorrect instrument settings
2. Reagent Problems
- Expired reagents
- Improper reagent storage
- Reagent contamination
- Deteriorated or poor-quality reagents
3. Calibration Errors
- Incorrect calibration
- Missed calibration schedule
- Calibration drift
- Use of faulty calibrators
4. Quality Control Material Problems
- Expired QC materials
- Improper storage or handling
- Incorrect reconstitution of lyophilized controls
- Contaminated control samples
5. Operator Errors
- Incorrect pipetting
- Improper sample handling
- Failure to follow Standard Operating Procedures (SOPs)
- Data entry or recording mistakes
6. Environmental Factors
- Temperature fluctuations
- High humidity
- Dust or contamination
- Unstable power supply
7. Sample-Related Problems
- Hemolyzed samples
- Insufficient sample volume
- Incorrect sample preparation
- Sample contamination
8. Poor Maintenance
- Delayed preventive maintenance
- Worn-out instrument parts
- Lack of routine cleaning
- Failure to replace consumables
Signs of QC Failure
- QC result outside ±2 SD or ±3 SD
- Violation of Westgard Rules
- Shift or trend on the Levey–Jennings chart
- Repeated QC failures
- Unexpected patient results
Corrective Actions
Steps for Corrective Actions
1. Stop Patient Testing
- Do not report patient results.
- Suspend testing until the QC problem is resolved.
2. Repeat the QC Test
- Run the same QC sample again.
- If the repeat result is acceptable, continue testing.
- If QC still fails, investigate further.
3. Check the QC Material
- Verify the expiry date.
- Ensure proper storage conditions.
- Check for contamination or incorrect preparation.
- Use a fresh QC material if necessary.
4. Inspect Reagents
- Check reagent expiry dates.
- Ensure reagents are stored correctly.
- Replace expired or deteriorated reagents.
5. Verify Calibration
- Check whether the analyzer is properly calibrated.
- Recalibrate the instrument if required.
- Run QC again after calibration.
6. Check Instrument Performance
- Inspect the analyzer for errors or alarms.
- Clean probes, cuvettes, and other components.
- Perform routine maintenance if needed.
7. Review Operator Technique
- Ensure correct pipetting and sample handling.
- Follow the Standard Operating Procedure (SOP).
- Repeat testing if operator error is suspected.
8. Document and Record
- Record the QC failure.
- Document the cause and corrective actions taken.
- Maintain records for quality assurance and laboratory audits.
9. Repeat QC Before Testing Patient Samples
- Perform QC again after corrective actions.
- Resume patient testing only when QC results are within acceptable limits.
Difference Between QA, QC, and EQA
| Feature | Quality Assurance (QA) | Quality Control (QC) | External Quality Assessment (EQA) |
|---|---|---|---|
| Purpose | Overall quality system | Daily monitoring | Compare laboratories |
| Frequency | Continuous | Daily | Periodically |
| Focus | Entire laboratory process | Analytical phase | Inter-laboratory performance |
| Performed by | Laboratory management | Laboratory staff | External agency |
Advantages of Quality Control
- Ensures accurate and reliable laboratory test results.
- Improves the precision and consistency of test results.
- Detects random and systematic analytical errors.
- Prevents the release of incorrect patient reports.
- Enhances patient safety by supporting accurate diagnosis and treatment.
- Monitors the performance of laboratory instruments.
- Verifies the quality and stability of reagents and control materials.
- Reduces repeat testing, saving time and laboratory costs.
- Improves the efficiency and productivity of laboratory operations.
- Maintains consistency in test results over time.
- Supports compliance with quality standards such as ISO 15189, NABL, and CAP.
- Builds confidence among clinicians, patients, and healthcare providers.
- Facilitates early detection of instrument or reagent problems.
- Supports continuous quality improvement in laboratory services.
- Improves the overall credibility and reputation of the clinical laboratory.
Limitations of Quality Control
- QC cannot detect all laboratory errors, especially pre-analytical and post-analytical errors.
- It mainly monitors the analytical phase of laboratory testing.
- QC cannot completely eliminate human errors such as incorrect sample handling or data entry.
- It requires trained and skilled laboratory personnel for proper implementation and interpretation.
- Regular use of QC materials, reagents, and maintenance increases laboratory costs.
- QC requires routine documentation, monitoring, and record keeping, which can be time-consuming.
- Incorrect interpretation of QC results may lead to unnecessary rejection of acceptable test runs.
- QC cannot identify the exact cause of a failure; further investigation is often required.
- Instrument malfunction may not always be detected immediately by QC alone.
- Effective QC depends on proper calibration, maintenance, and adherence to Standard Operating Procedures (SOPs).
- Poor-quality control materials or expired reagents can produce misleading QC results.
- QC should be combined with Quality Assurance (QA) and External Quality Assessment (EQA) for complete laboratory quality management.
Best Practices for Effective QC
- Run QC at the start of each shift.
- Use at least two levels of control (normal and abnormal).
- Store control materials as recommended.
- Calibrate instruments regularly.
- Review Levey–Jennings charts daily.
- Apply Westgard rules consistently.
- Participate in EQA programs.
- Document all corrective actions.